The Office for National Statistics has produced some infographics to celebrate World Environment Day. This has left the BBC statistics editor somewhat bemused. As the UK’s natural capital was calculated to be worth £1.5 trillion in 2011 (I expect it’s worth a bit less after the last four years of Coalition Government) which is the same as the national debt, he shrewdly asks whether we can sell it to pay off the debt. Don’t go giving George Osborne ideas!
Another statistic in the ONS’s infographic caught my eye. It said that the dominant habitat in the UK was “pastures” covering 22% of the land surface; and “semi-natural grasslands” cover another 17%.
I had a moment. I wondered, what could this mean? Was it a horrendous mistake – had someone left a couple of noughts off?
Now the UK is 24.3 million hectares, so 17% of this is 4.1 million hectares. There was I for years at the Grasslands Trust banging on about how little semi-natural grassland was left in the UK and blow me there was masses after all. Where could this enormous amount of semi-natural grassland have been hiding all the time? I had a look back at the UK National Ecosystem Assessment. The figures are on page 167 of the grassland chapter (table 6.1).
The NEA estimated 216000 ha of semi-natural grassland in priority habitats, those being the ones full of wildlife. Then there is another 1.476 million hectares in upland acid grassland. This is very poor in wildlife and is basically that mass of upland overgrazed heathland that has been grazed by sheep for decades – the stuff George Monbiot talks about in such scathing terms. So those two together make 1.692 million hectares. I would struggle to call the upland sheepwrecked landscape semi-natural grassland but people do.
Even including the sheepwrecked uplands, we are still way less than half way to the ONS figure. Where could they have got the other 2.4 million hectares from? I had another look at the infographic – there, winking at me, was a hotlink – “download the data” it said. I felt like Alice looking at the bottle which said “drink me”. I downloaded. The excel spreadsheet opened to reveal……
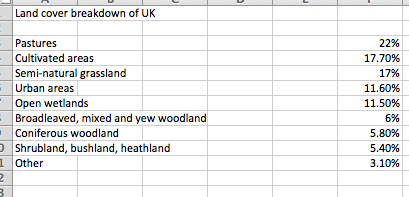
ONS figures
I felt swindled. There were no data, just a repeat of the figures in the infographic. Finally I found where the data originated, an ONS report looking at changes in land use cover. But that still drew a blank (other than noting that bracken had been lumped in with semi-natural grassland.) Then I realised what they had done. They had taken the figures for grassland from the Countryside Survey. CS breaks down grassland into neutral, calcareous and acid grassland, but these are almost all semi-improved grasslands; they are relatively poor in species of flower other than the very commonest, plus a few species of grass. They tend to have 10 or 15 species of plant in a field if you’re lucky. The difference in plant species richness between the “improved” pastures which the ONS call pastures and the semi-natural grasslands is actually very small. Note that the UK National Ecosystem Assessment specifically excluded these semi-improved grasslands from their definition of semi-natural, for good reason.
So there you have it. The ONS has ignored the approach taken in the UK National Ecosystem Assessment, which excluded the large area of semi-improved grassland from what they regarded as semi-natural. By doing so they bump up the figure for semi-natural grasslands to a staggeringly healthy figure of 17% of UK land cover. And hunky dory we don’t need to do anything about conserving semi-natural grasslands any more. Simples.

“When I use a word,’ Humpty Dumpty said in rather a scornful tone, ‘it means just what I choose it to mean — neither more nor less.’
’The question is,’ said Alice, ‘whether you can make words mean so many different things.’
’The question is,’ said Humpty Dumpty, ‘which is to be master — that’s all.”
― Lewis Carroll, ‘Through the Looking Glass, And What Alice Found There’